
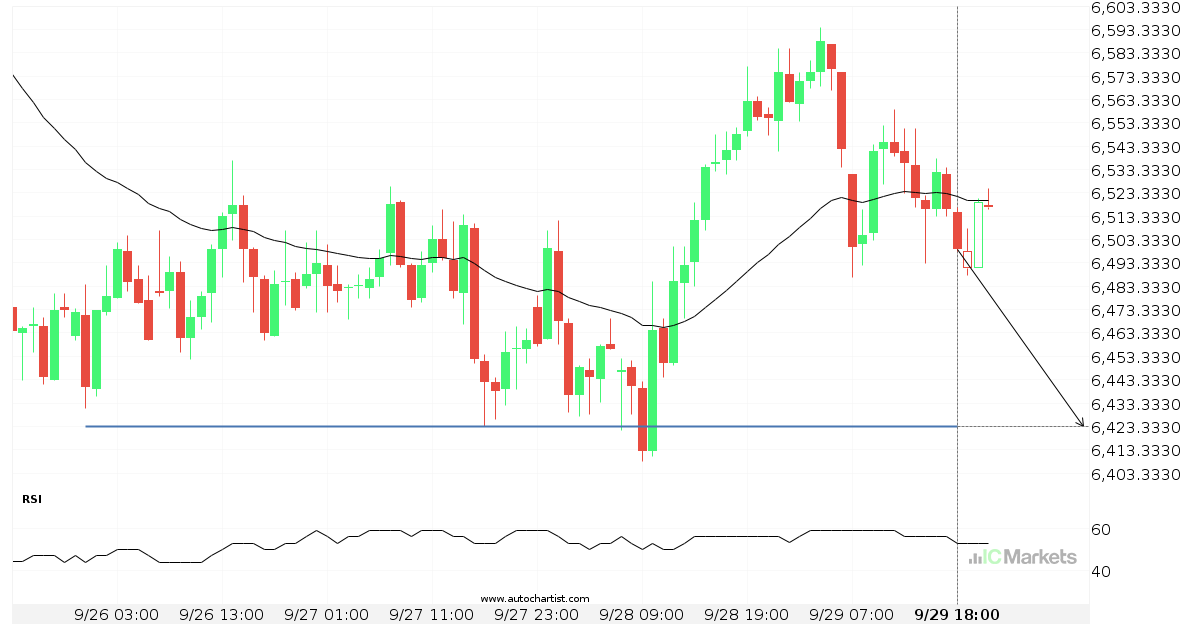
A final push possible on Australia 200 Index
Australia 200 Index is heading towards 6423.1802 and could reach this point within the next 17 hours. It has tested this line numerous times in the past, and this time could be no different, ending in a rebound instead of a breakout. If the breakout doesn’t happen, we could see a retracement back down to […]
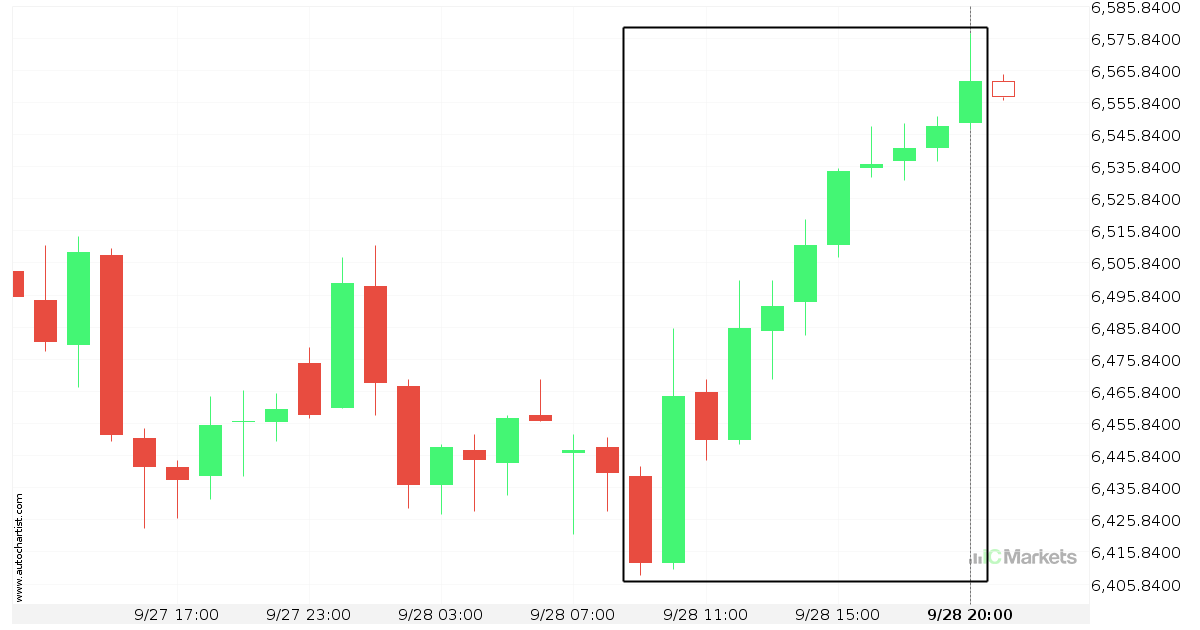
Australia 200 Index experienced an exceptionally large movement
For those of you that don’t believe in trends, this may be an opportunity to take advantage of an exceptional 2.34% move on Australia 200 Index. The movement has happened over the last 11 hours. For those trend followers among you, you may think about riding this possible trend.
Hong Kong 50 Index experienced an exceptionally large movement
For those of you that don’t believe in trends, this may be an opportunity to take advantage of an exceptional 2.59% move on Hong Kong 50 Index. The movement has happened over the last 23 hours. For those trend followers among you, you may think about riding this possible trend.
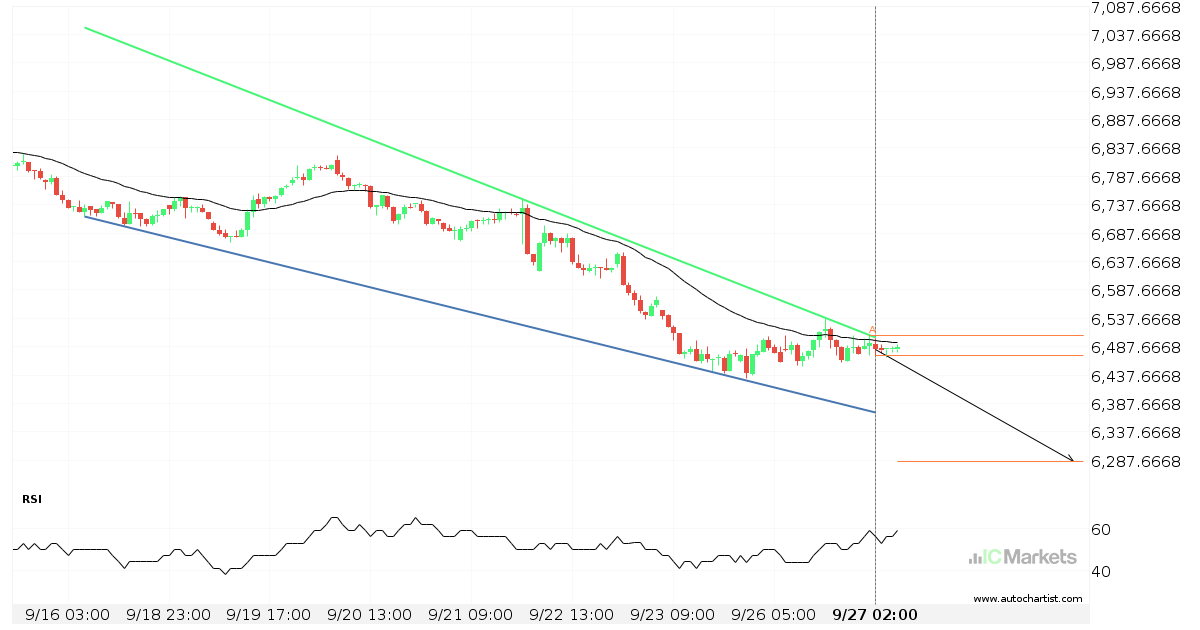
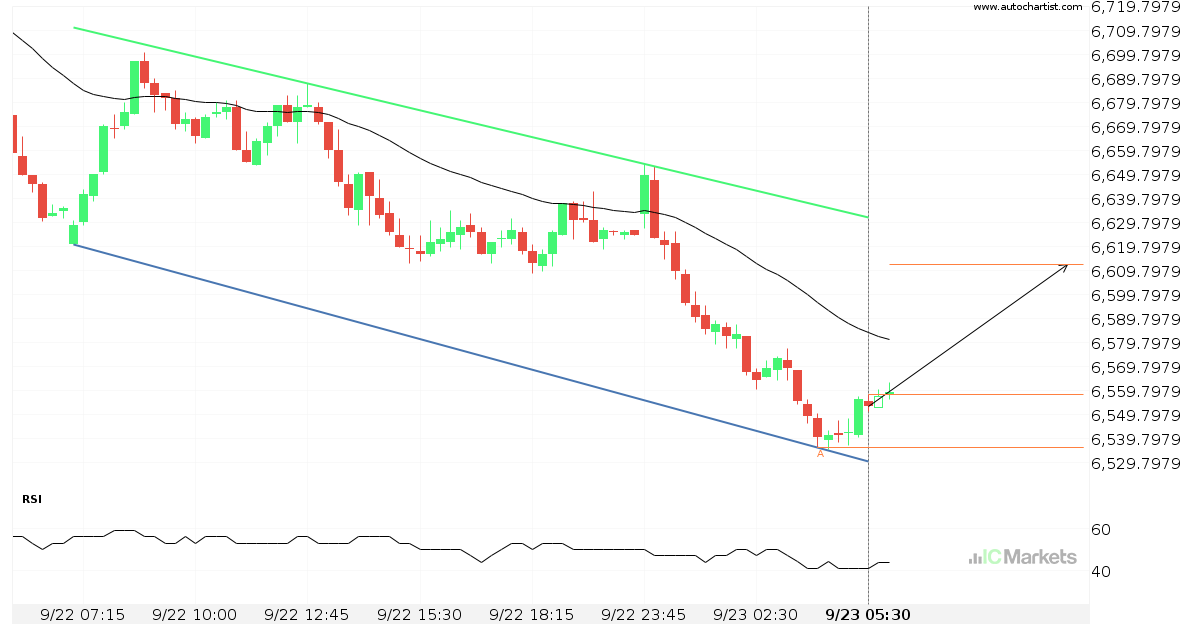
Australia 200 Index approaching support of a Falling Wedge
Australia 200 Index is approaching the support line of a Falling Wedge. It has touched this line numerous times in the last 11 days. If it tests this line again, it should do so in the next 2 days.
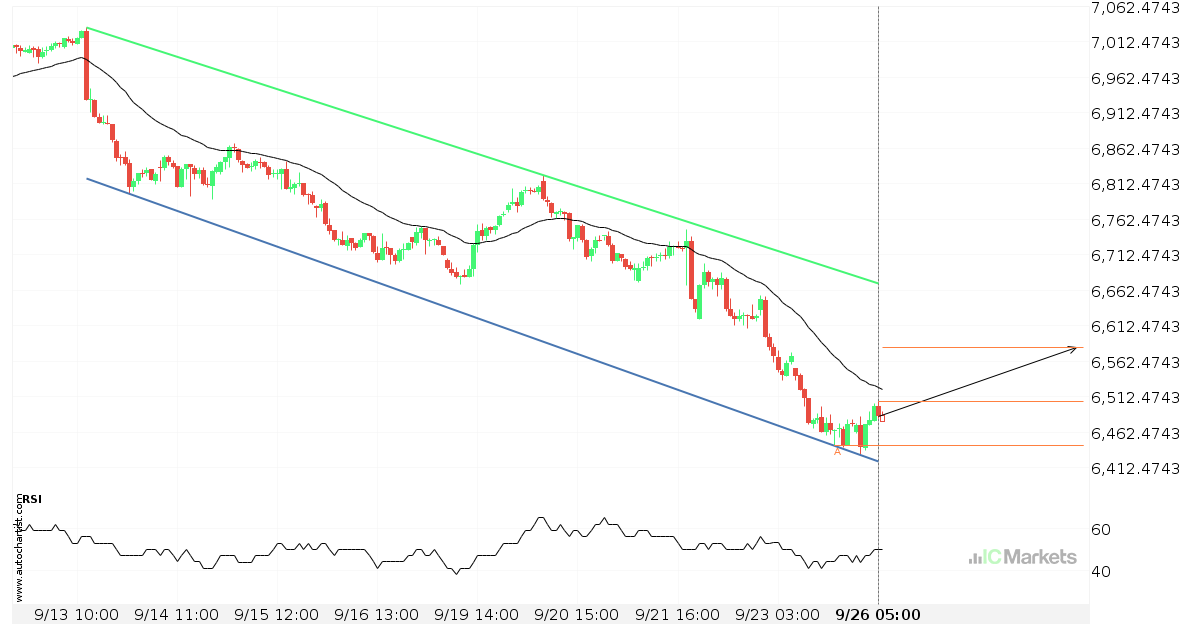
Hong Kong 50 Index approaching support of a Channel Down
Hong Kong 50 Index is approaching the support line of a Channel Down. It has touched this line numerous times in the last 13 days. If it tests this line again, it should do so in the next 3 days.
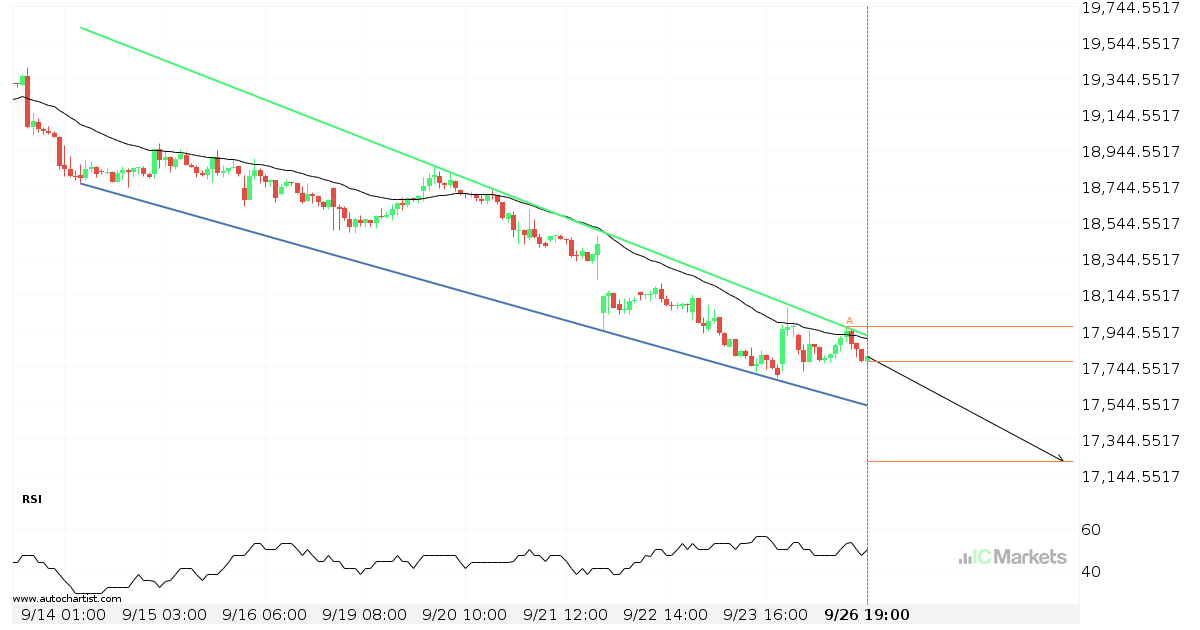
Australia 200 Index approaching resistance of a Channel Down
Australia 200 Index is approaching the resistance line of a Channel Down. It has touched this line numerous times in the last 13 days. If it tests this line again, it should do so in the next 3 days.
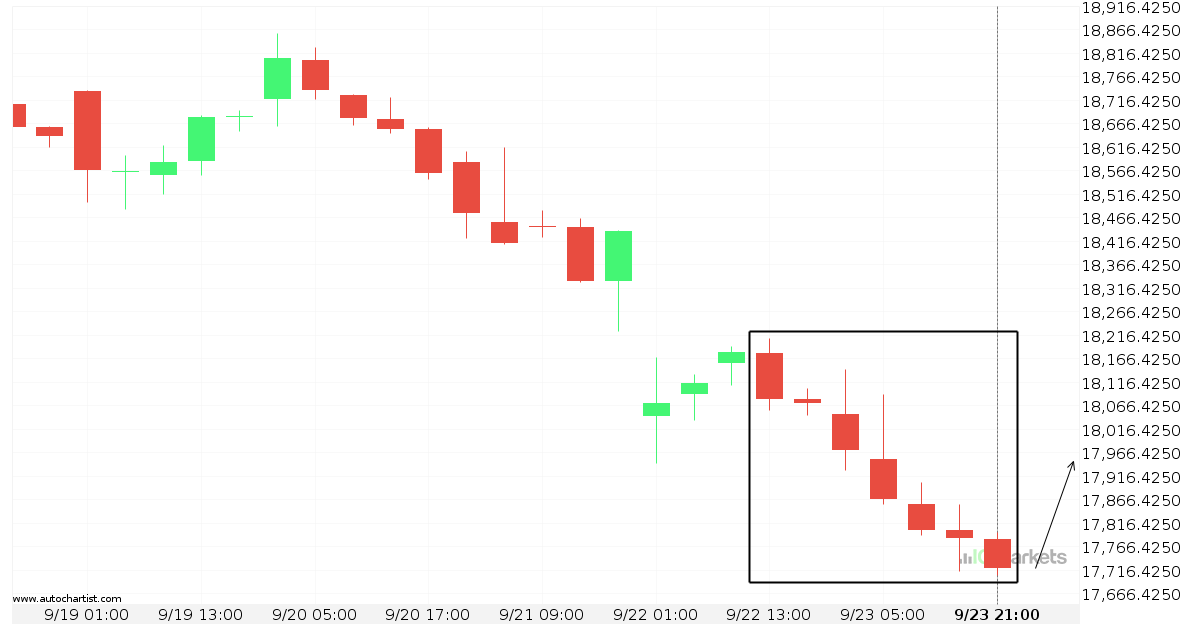
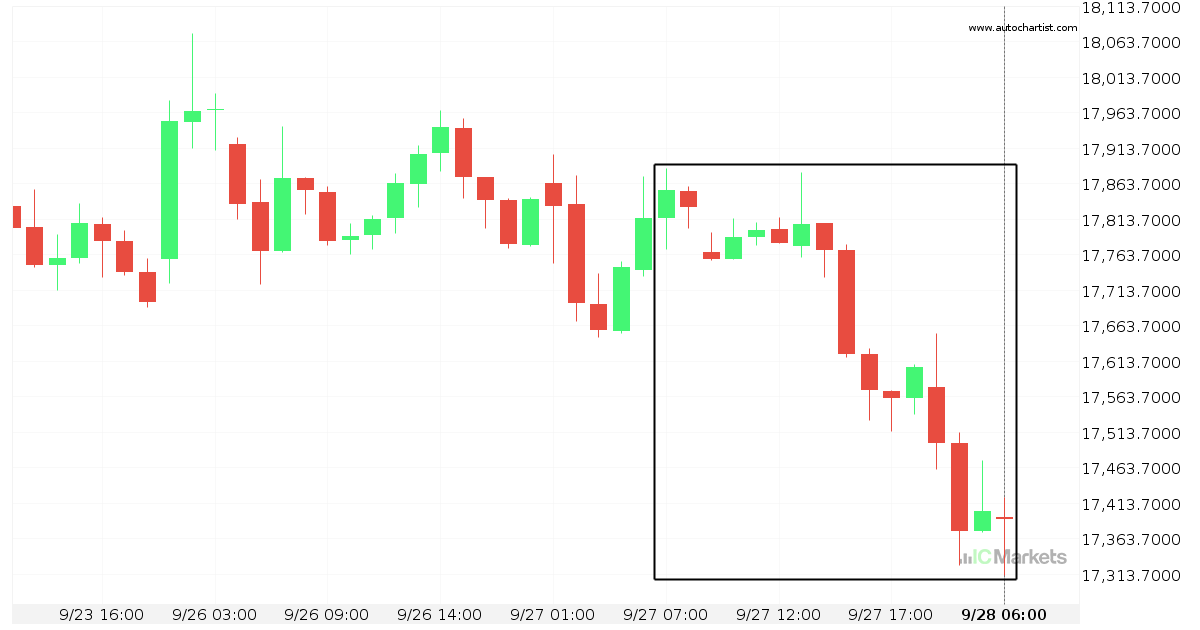
Hong Kong 50 Index experienced 7 consecutive 4 hour bearish candles
For those of you that don’t believe in trends, this may be an opportunity to take advantage of an exceptionally large amount of consecutive bearishcandles on Hong Kong 50 Index. The movement has happened over the last 2 days. For those trend followers among you, you may think about riding this possible trend.
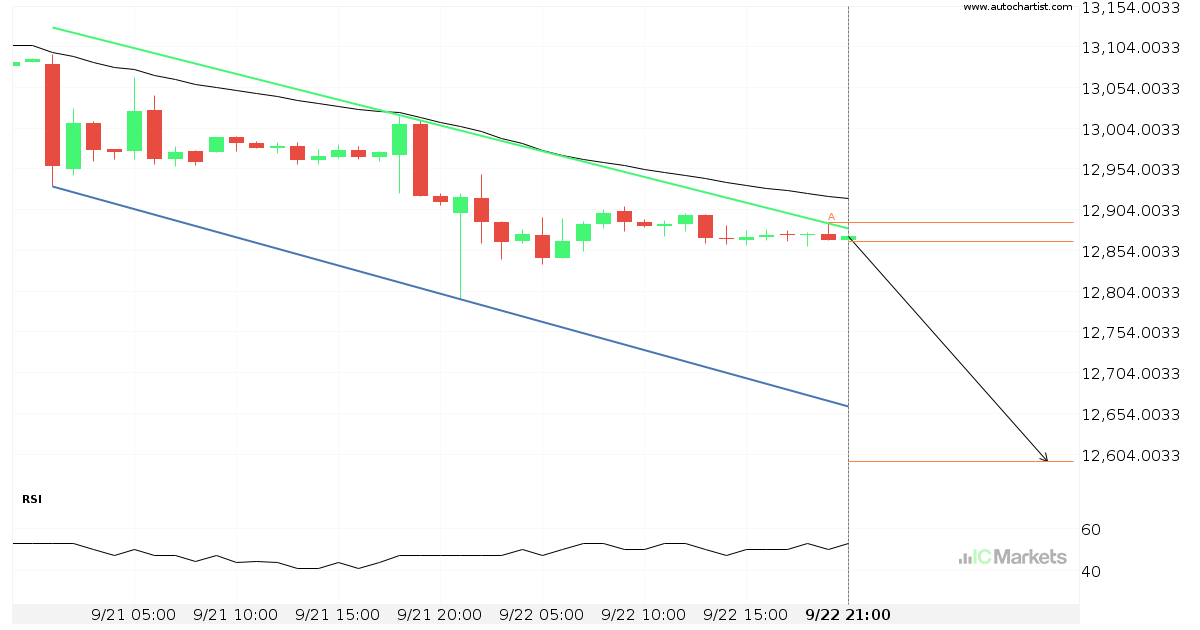
Australia 200 Index approaching resistance of a Channel Down
Australia 200 Index is approaching the resistance line of a Channel Down. It has touched this line numerous times in the last 22 hours. If it tests this line again, it should do so in the next 6 hours.
Possible breach of support level by FTSE China A50 Index
FTSE China A50 Index is moving towards a support line which it has tested numerous times in the past. We have seen it retrace from this line before, so at this stage it isn’t clear whether it will breach this line or rebound as it did before. If FTSE China A50 Index continues in its […]
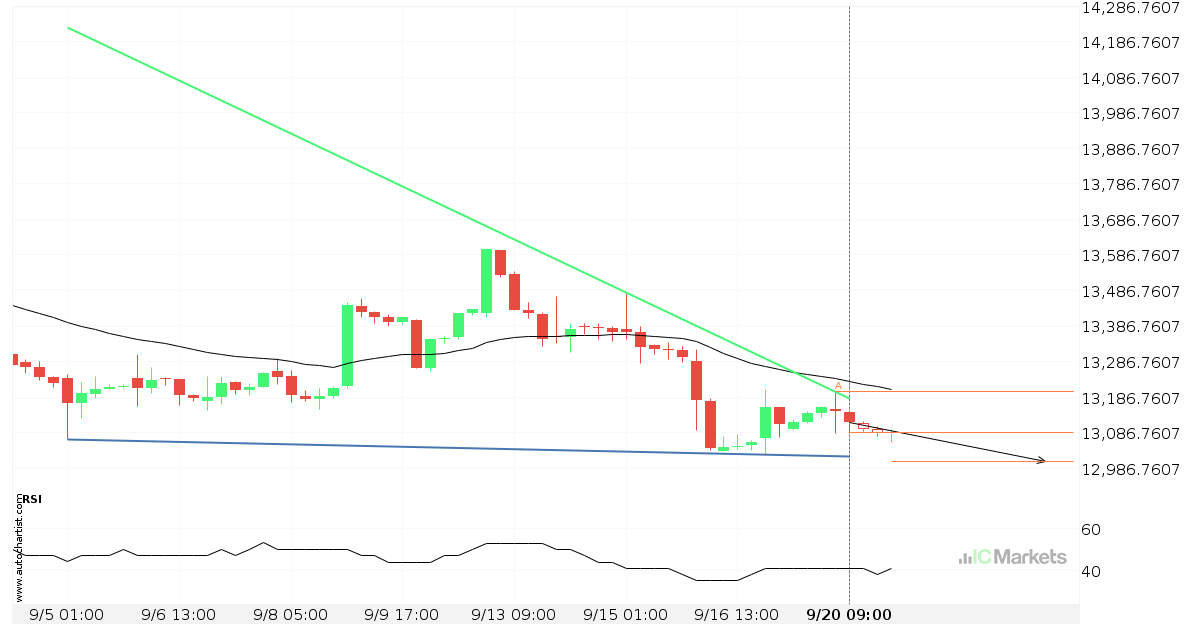
Either a rebound or a breakout imminent on FTSE China A50 Index
FTSE China A50 Index is heading towards the support line of a Falling Wedge. If this movement continues, the price of FTSE China A50 Index could test 13006.0960 within the next 3 days. It has tested this line numerous times in the past, so this movement could be short-lived and end up rebounding just like […]